
Random Walks and Portfolio Insurance
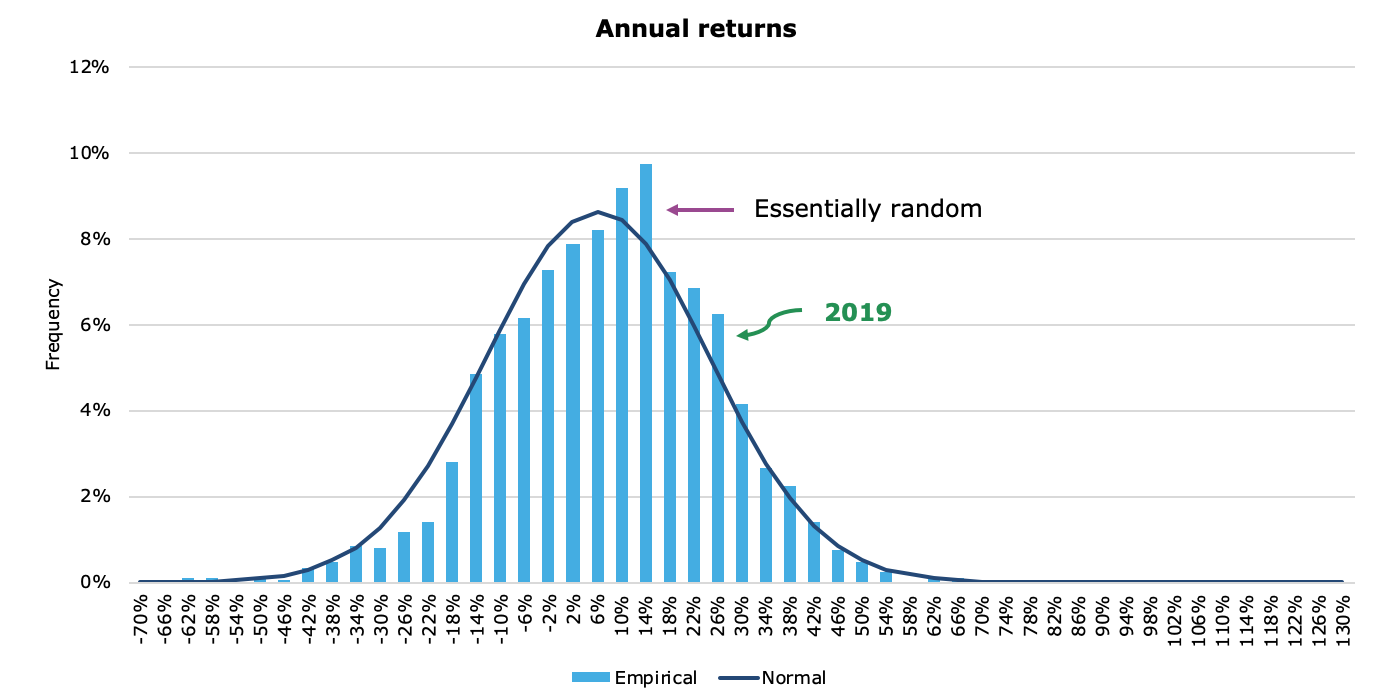
In financial markets, traders have long looked for mathematical relationships between and within assets, to aid in speculation and price prediction. As data aggregation improved, and information became more widely distributed in the 1930s and 1940s, financial analysts quickly realized that the stock market as a whole, as well as individual securities, followed Bell Curve distributions, at least in most time periods. The performance of individual securities on a single day was essentially random, but their overall performance in a time period could be graphed, as seen below:
This flowed logically from the concept of random events that Brownian motion described. In the mid- 1800s, scientist Robert Brown saw that particles in a fluid subdomain bounced around randomly, with their individual movements being essentially unpredictable- these movements were completely random. Drawing on Brownian motion, mathematicians had created Probability Theory, which could estimate the given probability (not certainty) of a set of outcomes. As an analogy, predicting the result of an individual coin toss accurately every time is essentially impossible, but if you do it 100 times, Probability Theory will tell you that you have a very high probability of 50 heads and 50 tails, or something close to it (45/55 or 53/47 for example). The likelihood of 95 heads and 5 tails, an extreme outlier, would be very close to 0. This is because there is a 50% probability of either heads or tails- and thus the distribution of 100 coin flips should roughly match this probability.
This theory of randomness of prices as it applied to finance came to be known as the Random Walk Theory- and predicted that prices were basically completely unpredictable. Understanding this concept, traders in the 1960s observed that the probability was great that returns on a single equity security would hover between some set performance range, like -10% and +10%. Rarely did the return hit the extreme ends of the curve. It didn’t matter what the time period was, 1 day, 1 month, or 1 year, the traders always had trouble reliably predicting a single future movement (like predicting heads/tails on a single coin toss), but could reliably say what the probability of variance over time (outcome of 100 coin tosses) would be, and map this mathematical distribution on a bell curve.
These Bell Curve distributions, after being modified for applications in financial markets, came to be known as Value At Risk (VaR) models. Over the course of the 1960s and 1970s, these models came to be widely used in the asset management industry. Essentially what these VaR models could do was provide a statistical technique used to measure the amount of potential loss that could happen in an investment portfolio over a specified period of time. Value at Risk gives the probability of losing more than a given amount in a given portfolio.
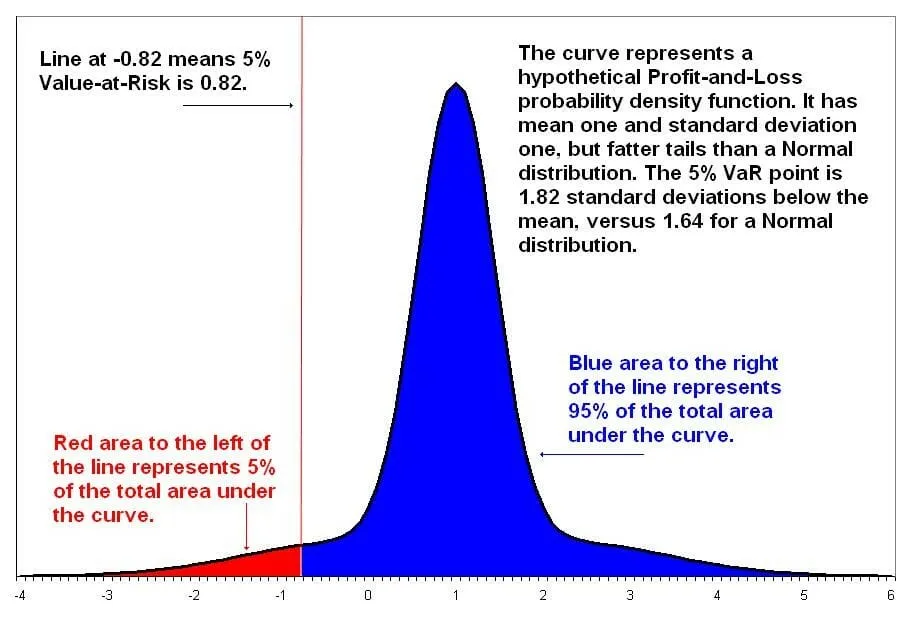
You can see from the above that these models have “skinny tails”, that is to say, they predict the likelihood of extreme events (standard deviation of 3 or more) happening as very low, especially on the downside (see above). Outlier events were thus coined “tail risk”, occurrences that only show up on the far tails of the distribution. These models were built using the recorded historical prices of thousands of commodities, equities, and bonds. For earlier markets, they would even plug in estimates created by econometricians (i.e. Corn prices in 1430) to arrive at a large enough data set. With this data, asset managers could feel safe utilizing leverage and complex derivatives in risky investments, as these models told them that the likelihood of severe losses (-30% for example) in a single day was near-zero.
At the same time, Eugene Fama, an American economist freshly minted with a PhD from the University of Chicago, developed his Efficient Markets Hypothesis in early 1970. Drawing on the random walk theory, Fama posited that since stock movements were random, it was impossible to “beat the market”. Current market prices incorporated all available and future information, and thus buying undervalued stocks, or selling at inflated prices, was not feasible. Making consistent profits was impossible– if you made money, you just got “lucky” as the market randomly moved in your favor after you made the trade. The price, therefore, was always “right”.

This further emboldened investors and whetted their risk appetite. Armed with these two theories, they started making statistical algorithms that modeled the stock market, and loaded themselves up with more risk. Starting in the early 1980s, portfolio insurance started to gain traction within the industry. This “insurance” basically was an automated system that short-sold S&P 500 Index futures in case of a market decline. This concept was invented by Hayne Leland and Mark Rubinstein, who started a business named Leland O’Brien Rubinstein Associates (LOR) in 1980, and was developed into a computer program commonly referred to by the same acronym. They were successful in marketing this product, and by the mid-1980s, hundreds of millions of dollars of Assets Under Management (AUM) from institutions ranging from investment banks to large mutual funds were protected by this new-fangled product.
LOR was a program that dynamically hedged, i.e. would observe market conditions, and understanding it’s own portfolio risk, would actively adjust in real time. Today, dynamic hedging is used by derivative dealers to hedge gamma or vega exposures. Because it involves adjusting a hedge as the underlier moves—often several times a day—it is “dynamic.” The founders of LOR touted it as a program that would actively work to protect a portfolio, a “fire and forget” approach that would allow portfolio managers and traders to focus on alpha-generation rather than worrying about potential losses.
Black Monday- October 19th, 1987
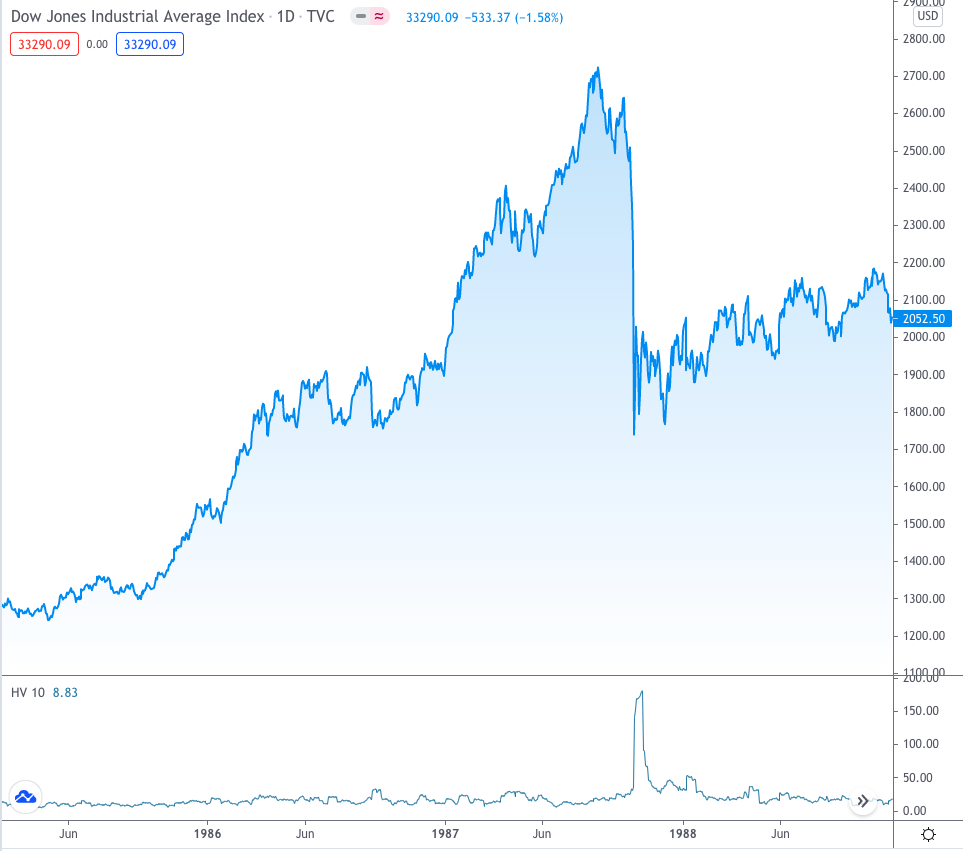
Stock markets raced upward during the first half of 1987. By late August, the DJIA (Dow Jones) had gained 44 percent in a matter of seven months, stoking concerns of an asset bubble. In mid-October, a storm cloud of news reports undermined investor confidence and led to additional volatility in markets. The federal government disclosed a larger-than-expected trade deficit and the dollar fell in value. The markets began to unravel, foreshadowing the record losses that would develop a week later.
Beginning on October 14, a number of markets began incurring large daily losses. On October 16, the rolling sell-offs coincided with an event known as “triple witching,” which describes the circumstances when monthly expirations of options and futures contracts occurred on the same day. By the end of the trading day on October 16, which was a Friday, the DJIA had lost 4.6 percent. The weekend trading break offered only a brief reprieve; Treasury Secretary James Baker on Saturday, October 17, publicly threatened to de-value the US dollar in order to narrow the nation’s widening trade deficit. Then the unthinkable happened.
Even before US markets opened for trading on Monday morning, stock markets in and around Asia began plunging. Additional investors moved to liquidate positions, and the number of sell orders vastly outnumbered willing buyers near previous prices, creating a cascade in stock markets. In the most severe case, New Zealand’s stock market fell 60 percent, and would take years to recover. Traders reported racing each other to the pits to sell. Author Scott Patterson describes the scene:
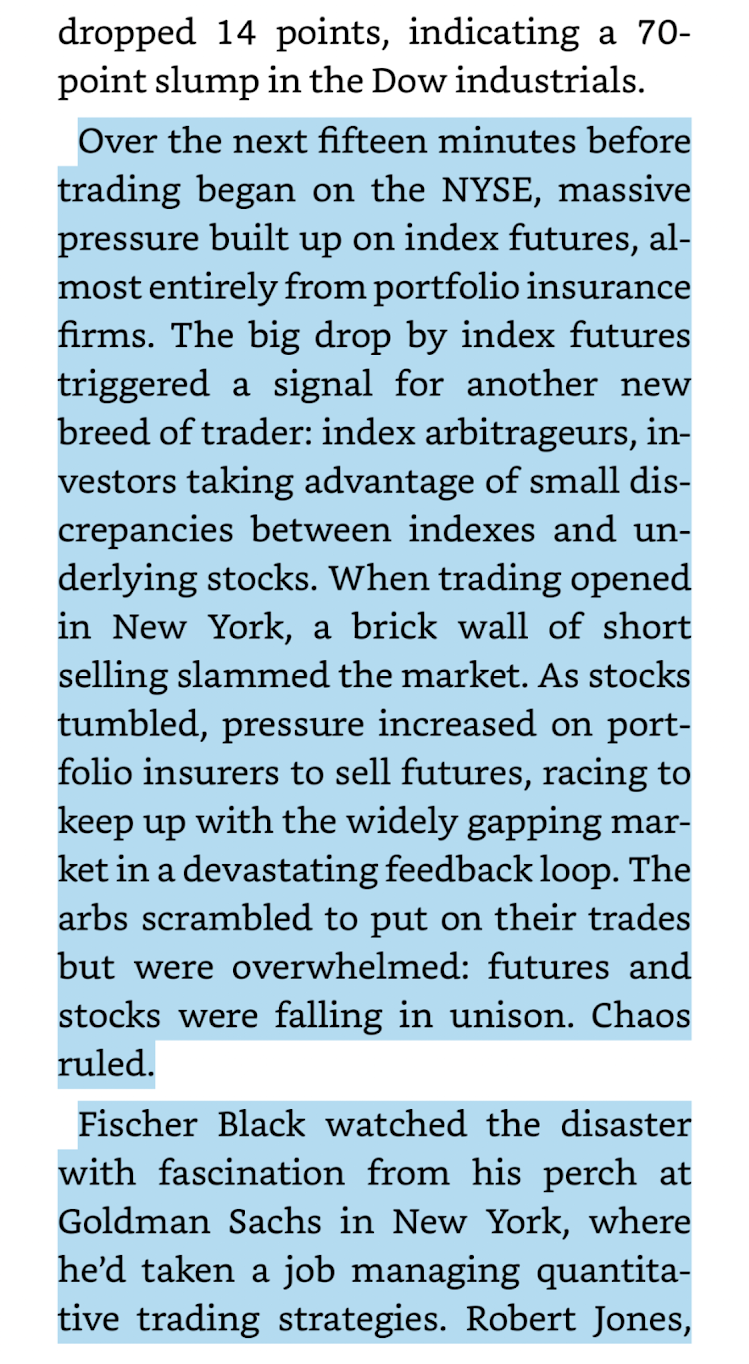
(The Quants, by Scott Patterson, page 51)
Traders on the floor of the NYSE reported seeing ticker numbers spinning so fast that they were unreadable. Liquidity vanished completely from the market. Sell orders flooded in so fast the infrastructure to record them started malfunctioning. At one point, specialists (individual market makers, and at this time were people on the floor representing a firm) simply stopped picking up the phone, which was ringing with dozens of institutions begging them to sell. Dozens of stocks were frozen in time. Those that weren’t were hit with massive volume. At one point, Proctor and Gamble was trading for $0.03. It had ended trading the previous Friday at $6.09. Market makers were trading off the stock prices that were recorded an hour ago, since the infrastructure was so backed up.
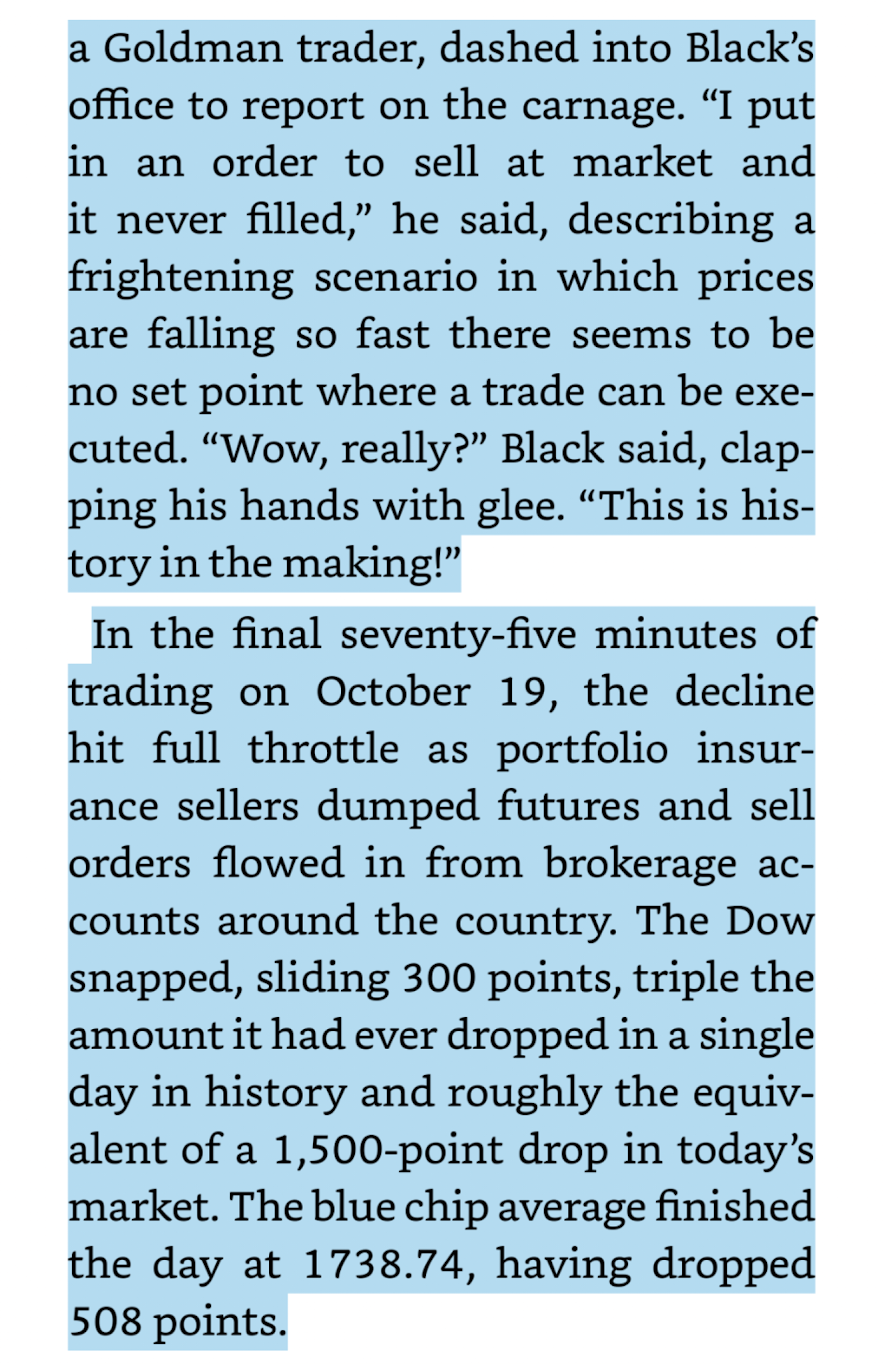
In the United States, this collapse quickly came to be known as “Black Monday”, with the DJIA finishing down 508 points, or 22.6 percent. “There is so much psychological togetherness that seems to have worked both on the up side and on the down side,” Andrew Grove, Chief Executive of technology company Intel Corp., said in an interview. “It’s a little like a theater where someone yells ‘Fire!’ (and everybody runs for the exit)”.
“It felt really scary,” said Thomas Thrall, a senior professional at the Federal Reserve Bank of Chicago, who was then a trader at the Chicago Mercantile Exchange. “People started to understand the interconnectedness of markets around the globe.” For the first time, investors could watch on live television as a financial crisis spread market to market – in much the same way viruses move through human populations and computer networks.
Black Monday represented a catastrophic rebuttal to the mathematicians and economists who created the Random Walk Theory and Value- At- Risk models. These probability theorists had stated that events like this were improbable- so improbable in fact that their models predicted Black Monday was IMPOSSIBLE. Thus, no one in the market had hedged or expected an event as extreme as this. In fact, some theoreticians started to doubt the validity of the previously iron-clad Efficient Market Hypothesis itself. Patterson continues:
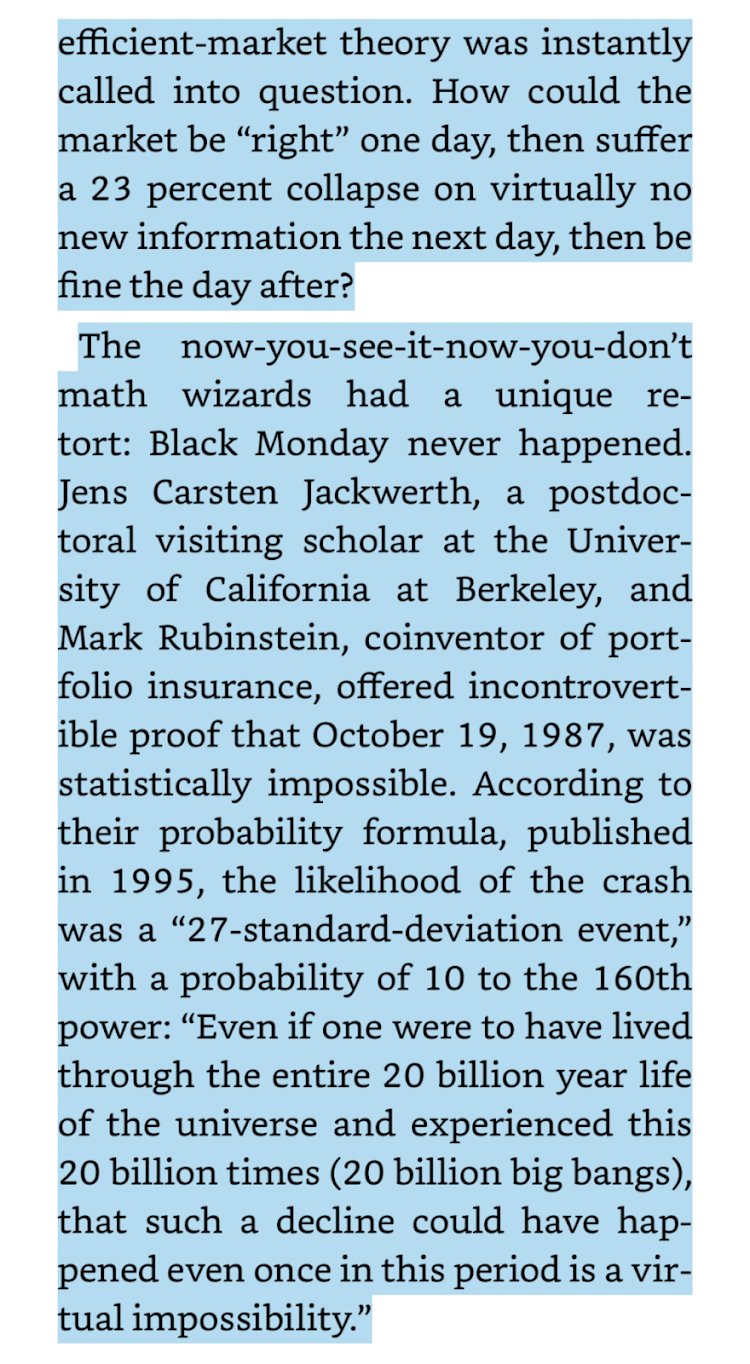
(The Quants, page 53)
Black Monday also represented a fascinating case study in the devastating effects of derivatives on financial markets. The Index Arbitrageurs, buying the S&P 500 futures being sold by portfolio insurance, had raced to short sell the underlying stock to stay net neutral. This was because by owning the S&P 500 futures, they effectively owned a small piece of every stock in the index. To hedge, they had to quickly short the underlying, so that any large loss in the index futures they owned would be offset by a gain on a short position in the individual stocks. However, the S&P 500 index itself was calculated based on the prices of the underlying securities. Thus, after Portfolio insurance sold the arbs futures, the Index arbs short sold billions of dollars worth of stock, the S&P future market tanked, and LOR, seeing the massive volatility and downward pressure on the market, sold more and more futures, which caused the Arbs to short more and more stock. This was the unwelcome discovery of a vicious positive feedback loop, a “shadow risk” that existed beneath the surface of the market, unbeknownst to the investors who traded in it. The Ouroboros had been awakened. These feedback loops, once initiated, continued until the underlying factors have been diminished or until the agents in the system are self-destroyed.
Derivatives and the Alchemy of Risk
Derivatives are financial contracts that derive their value from an underlying security, and have existed for as long as markets have. A futures contract, for example, is a legal agreement to buy or sell a particular commodity asset, or security at a predetermined price at a specified time in the future. The buyer of a futures contract is taking on the obligation to buy and receive the underlying asset when the futures contract expires, and the seller of the futures contract is taking on the obligation to deliver the underlying asset at the expiration date. These contracts have been around for millenia, with the earliest recorded contract dated to 1750 BC in Mesopotamia, or modern-day Iraq.
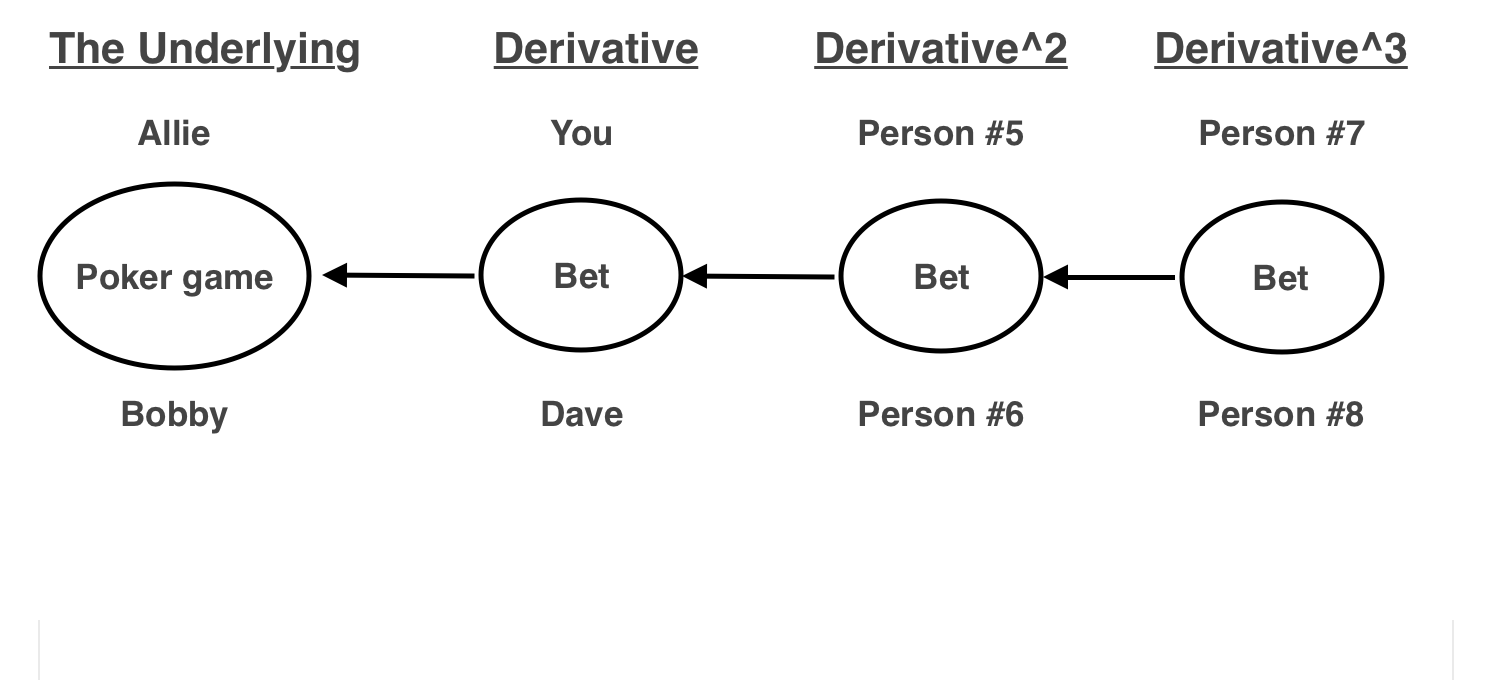
Say you’re in a casino and you want to make money off a poker game, but you are barred from playing the actual game. So, you grab another patron (Dave) and tell him you’d like to make a bet on the outcome of the game. You really think your friend Allie will win the game, so you’re willing to pony up $100 to bet on her winning. (In this example, the bet you make is the “derivative”. The underlying security’s returns are the results of the poker game.) Seeing your derivative bet, two other people get interested. They don’t want to bet on the game, rather they want to gamble on the outcome of your bet. They create their own bet, weighing probabilities and putting in funds accordingly. This is a second-order derivative. In the modern financial system, since derivatives are basically unregulated due to the Commodities Futures Modernization Act, (especially OTC derivatives or second-order or higher) this process can continue ad infinitum.
When creating a portfolio, most investors worry about their loss exposure. Buying any single equity is risky, and it is reasonable to want to reduce downside risk. This is part of the reason why derivatives were created. Through hedging, traders were able to change their gross exposure into a net exposure. Net exposure underlines the difference (net amount) between a hedge fund’s long positions and its short stock or derivative positions. Once calculated, the net exposure of a fund is usually presented in a percentage, displaying the fund’s risk with regard to market fluctuations.
Let’s break it down- say you are bullish on IBM. You go out and buy $50M of long dated call options (commonly called LEAPS) on IBM. Since you’re afraid of losing money in case IBM misses it’s earnings call, loses revenue, or experiences some other negative event while your position is open, you go and buy $40M of put options with the same expiry date. Thus, your new Net exposure position is only $10M long.
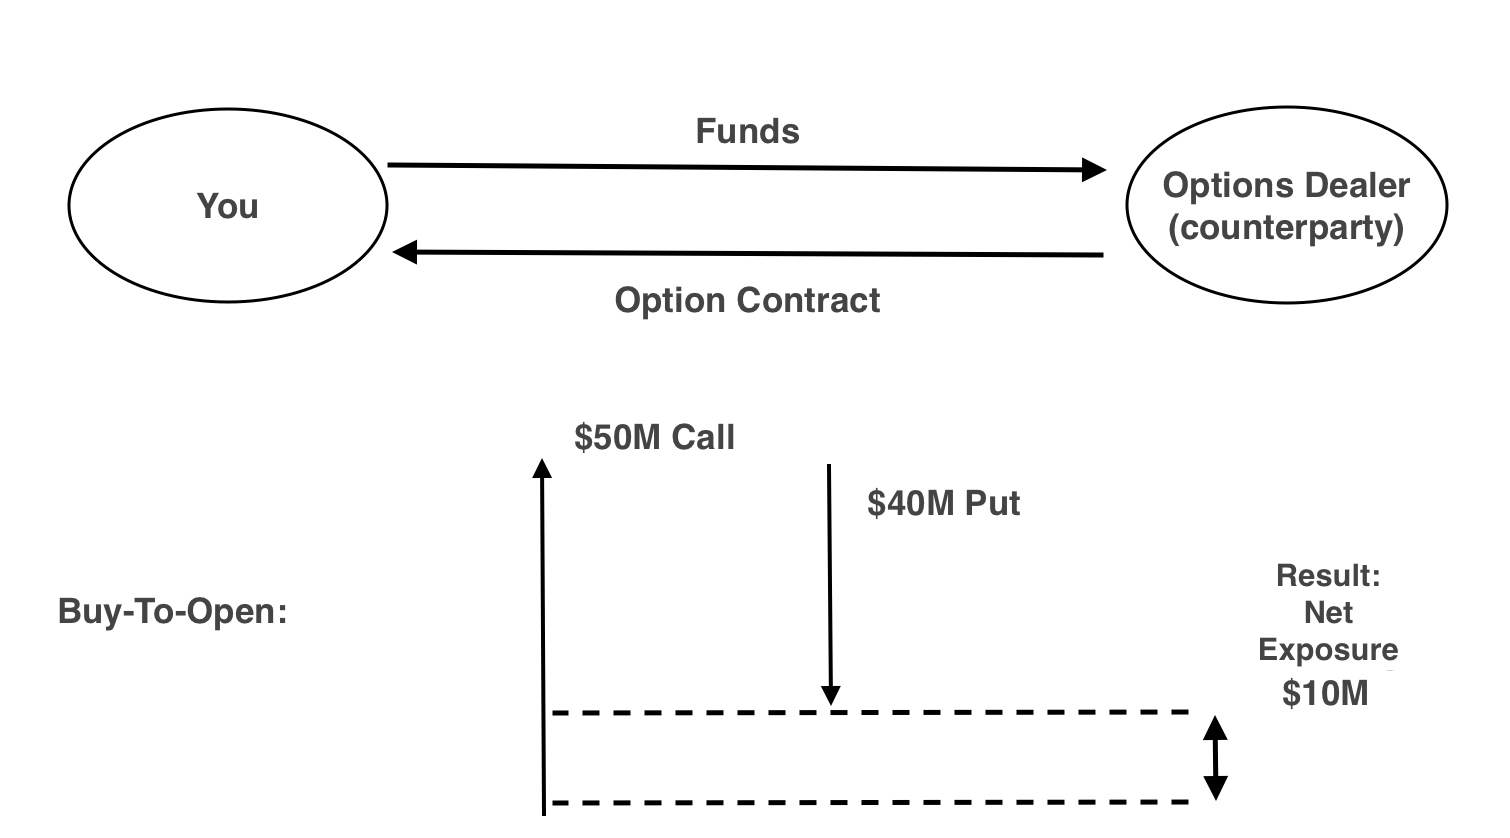
Using this mechanism, traders were able to hedge positions and reduce their theoretical risk. When you buy calls and puts, this net exposure is reduced, and at the same time, your assets increase. In the example above, your gross exposure (the gross value of the derivatives you own) will increase as you own both long calls and long puts.
(Don’t get this confused with being long/short or bullish/bearish a stock!! Long position for derivatives simply means YOU OWN the contract, short position means YOU OWE the contract. “Long/Short” is a general term in finance that can mean different things depending on the context!) Since both these calls and puts have value that you paid for, and represent the right to exercise at strike, they are both recorded as assets on your Balance Sheet. In the example above, you OWN $50M of calls and $40M of puts- your overall derivative gross exposure is $90M. Your net exposure is only $10M. Thus you have $90M of assets (subject to market changes of course) and “net risk” of $10M.
There’s three interrelated ways this goes seriously wrong. One is counterparty risk. A counterparty is someone who takes the opposite side of your trade- so if you are buying, they are the seller, and vice-versa. In derivatives, if the counterparty to your trade fails, i.e. goes bankrupt, the contract will most likely not be honored. This means if you are a hedge fund, and you wrote OTC options, your $90M of calls and puts, if they were written with a single counterparty (like Bear Stearns) will now be worth NOTHING.
This $90M “gross exposure” loss would represent an 800% HIGHER LOSS than the “theoretical” maximum loss of $10M which is your “Net Exposure”. If an options clearinghouse which is the counterparty to all listed options fails, MILLIONS of contracts would be worthless. The TRUE RISK is counterparty risk- this is what the models don’t understand.
Another way this goes wrong is if the underlying fails- the results are equally catastrophic. Going back to the poker game analogy, imagine if the people playing the actual poker game left the table. Now Derivative Bet #1 is worthless, since there’s nothing to bet on. Same goes with Derivative bet #2, and #3, and so on. If the Poker game had $25 in the pot, and each Derivative bet had $100 in each bet, this means that by the poker game ending, $325 worth of value was destroyed, from the elimination of just ONE REAL game worth $25. THIS is the explosive nature of derivatives.
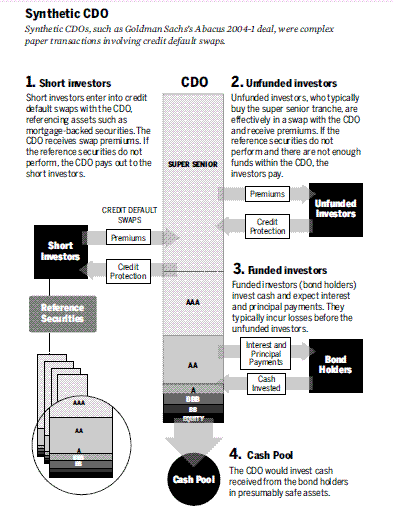
Let’s use the 2008 financial crisis as an example of underlying failure. (W Homeowner goes out and gets a loan (original poker game). The bank then sells that loan to an investment bank who makes a CDO out of it (a bet on the game) which trades on the value of the underlying. Then, another bank comes along and makes a synthetic CDO (a bet on the bet), and then takes out a Credit Default Swap on it (bet on a bet on a bet). This creates insane leverage to the underlying, and horribly dangerous results if the underlying collapses. Dr. Trimbath puts it like this: (Naked, Short and Greedy pg 221 (Ch 19))
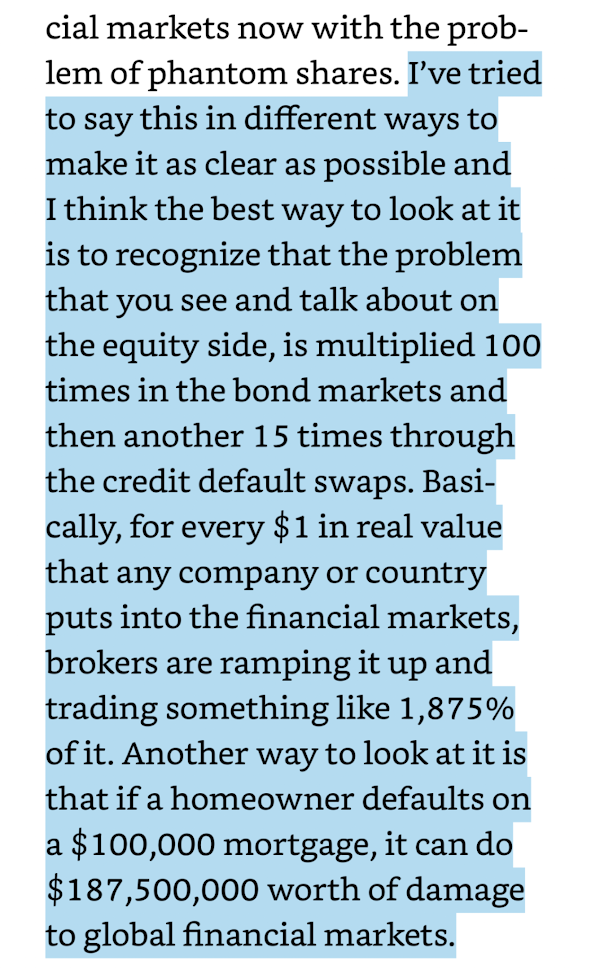
A third way this system can blow up is due to cross-collateralization, where one asset is pledged to multiple entities, creating more claims than assets that exist. This process is actually very common in the futures markets- bullion banks, for example, which hold gold and silver, will write between 2-10 futures contracts for every one oz of gold in the vaults.
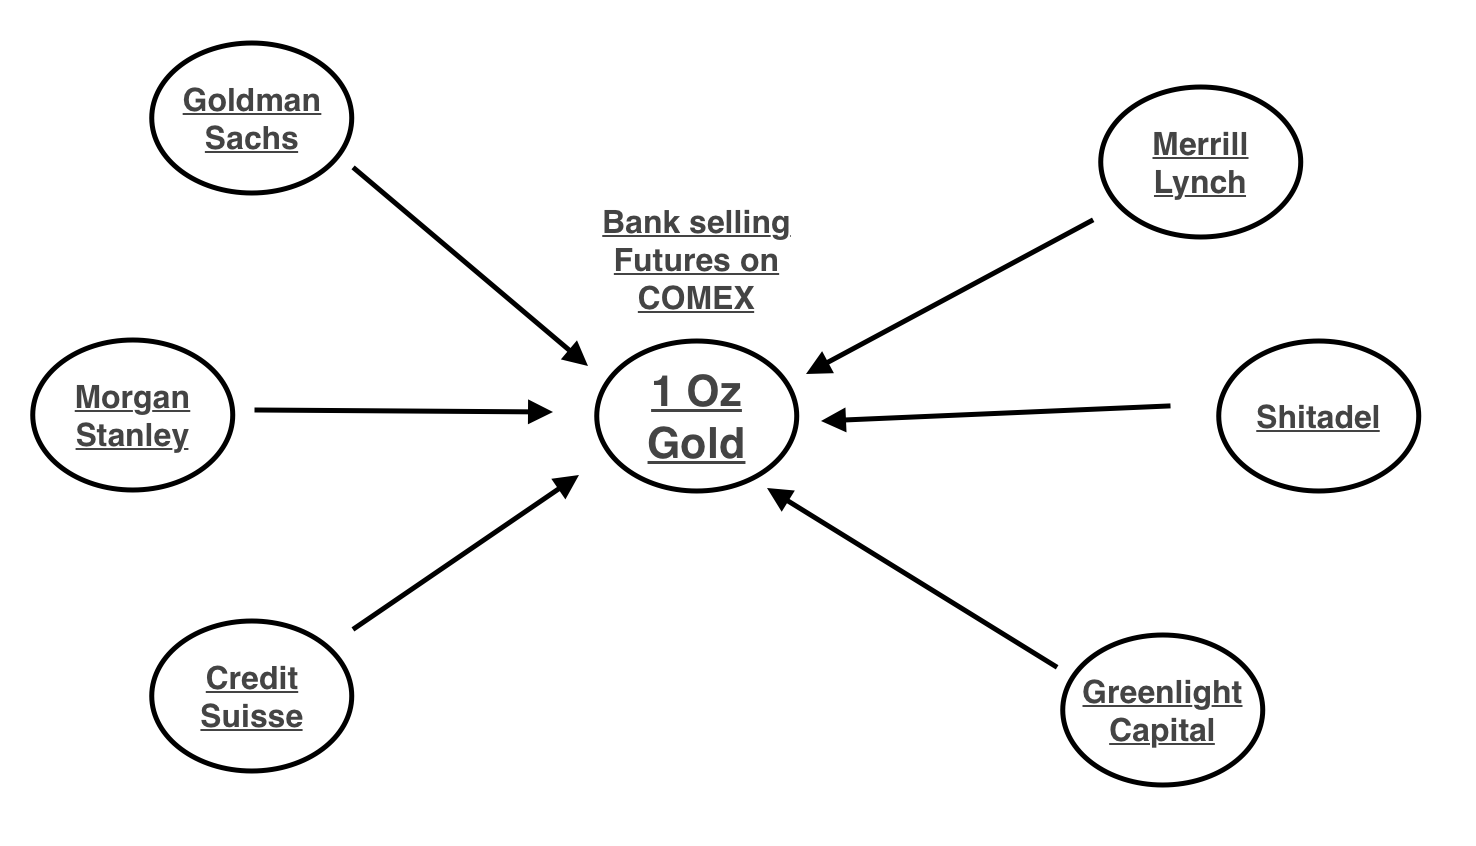
In the example above, the bullion bank (with the gold) writes 6 futures contracts (assume 1 oz per contract) and sells them to other financial institutions, but only has a single ounce of gold in the vault. They can do this since the vast majority of the futures (~85-90%) never get called in for settlement, and are instead rolled forward (this basically means when the old contract is about to expire, the holder sells it for cash, and then uses this money to buy a new futures contract with a different expiration date).
Thus, the bank/institution writing all these futures never has to actually deliver the underlying- the gold in this case. If all the futures contracts they write are called in at once, then the 1 oz of gold is given to the buyer, and the bank who wrote the contract is on the hook to deliver all 5 oz to the firms that are owed, and is forced to go into the market to purchase it- this is called a “Contract Delivery Squeeze” as outlined in this paper. If the bullion bank fails, all the futures written by it are now null and void, and the firms that weren’t able to take delivery get nothing.
(Side note: Notional Value Explained: Notional value is a term often used to value the underlying asset in a derivatives trade. It can be the total value of a position, how much value a position controls, or an agreed-upon amount in a contract-
The best explanation I’ve seen of this was on a recent post by reddit user u/Criand– ALL credit to him/her:
——————————————————————————————————————————
The Market Value is the value of the derivative at its current trading price.
The Notional Value is the value of the derivative if it was at its strike price.
E.g. A CALL Option represents 100 shares of ABC stock with a strike of $50. Perhaps it is trading in the market at $1 per contract right now.
Market Value= 100 shares * $1 per contract = $100
Notional Value= 100 shares* $50 strike price= $5,000
——————————————————————————————————————————
Systemic Risk
The recent Archegos Capital debacle was a classic example of the destructive power of derivatives. Using contracts like Total Return Swaps, Bill Hwang was able to leverage his fund more than 8x, making bets on the performance of a variety of Chinese and American equities. When the equities lost value, his fund was obliterated- a mere 12.5% drop in the underlying resulted in a complete loss of capital. But, his fund wasn’t the only firm affected- Credit Suisse was his counterparty, and thus lost more than $5.5 Billion, and counting. If derivatives are an explosive bottle, counterparty risk is a fuse- one that always runs to another bottle of Nitroglycerin.
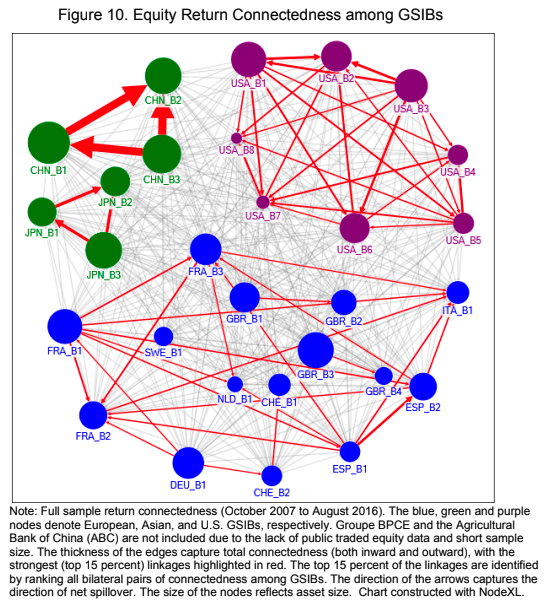
The modern financial system is effectively a complex network of institutions, tied to each other through these complex derivative contracts. GSIBs (Globally Systemic Important Banks) are the largest entities in the system, tied directly to thousands of institutions, and indirectly to hundreds of thousands. Here’s a fascinating map from an IMF White Paper on the GSIBs’ interconnectedness:
The entire derivatives market is HUGE. The BIS estimated the total notional value of the OTC derivatives market to be $640 Trillion in 2019! And that doesn’t even include exchange-listed derivatives like most common option contracts. More sober estimates put it somewhere north of $1 Quadrillion. Visual Capitalist has a great graph that demonstrates the monstrosity of this number. Numbers of this size are hard to wrap your head around- this is equivalent to a million billion, or a thousand trillion- for reference, the US economy is around $22 Trillion and the world economy is estimated to be $88 Trillion– thus the entire world economy could fit into the notional derivatives market 11x over and STILL not reach it. Every single bank is exposed, either directly or indirectly, to this market. For example, Deutsche Bank ALONE has over $47 Trillion in Notional gross exposure– TWICE the size of the entire US Economy!
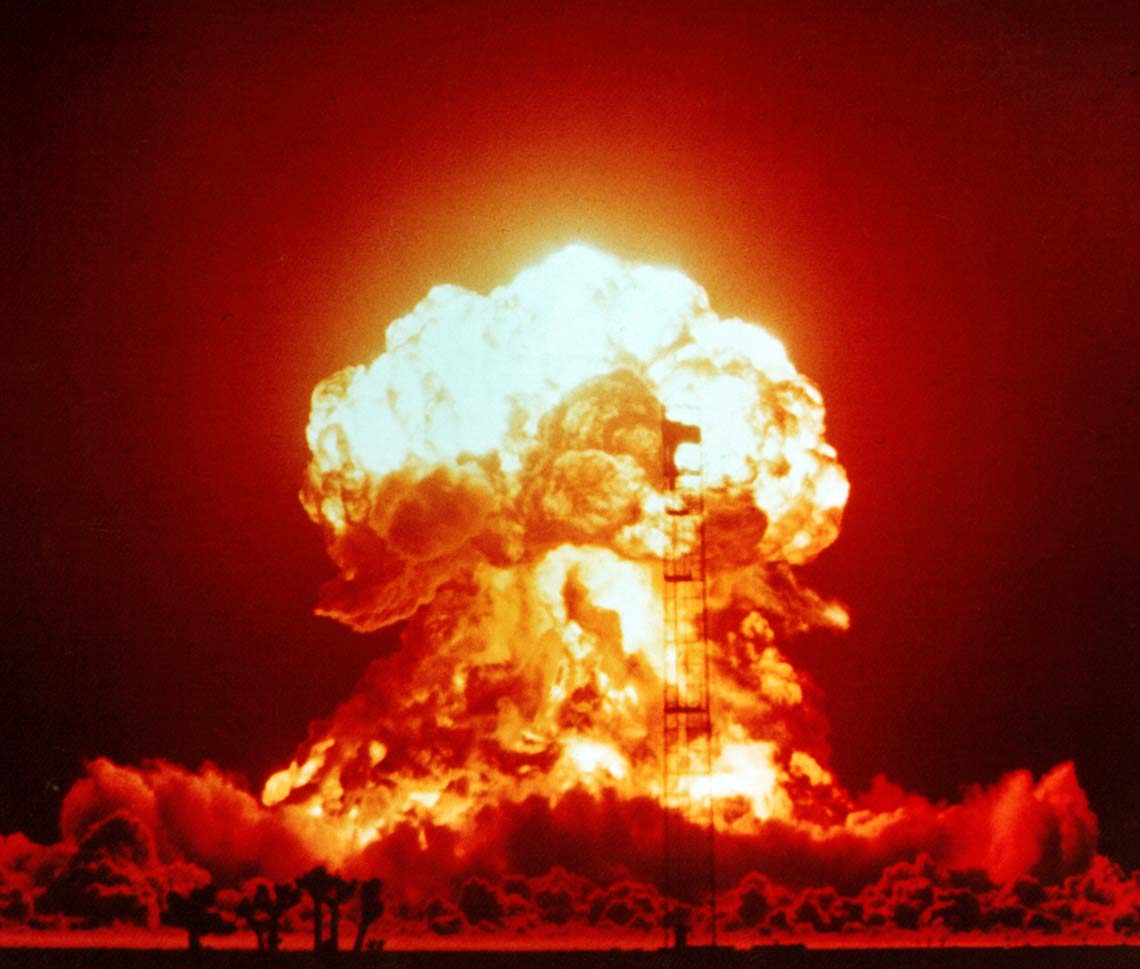
Through the magic of financial engineering, Deutsche is able to create a net exposure of only $22 Billion, equivalent to 0.046% of the notional. Thus, although on paper its risk is extremely small, the actual risk to the firm is enough to wipe it out basically overnight. This is what happened to institutions like AIG in the 2008 crisis – they insured more products than they could ever cover, and when the firms they insured came calling they were quickly forced into bankruptcy, requiring a $182 Billion bailout from the Federal Reserve. If the hedge funds with derivatives exposure (like Archegos) are the equivalent of an office rigged with nitroglycerin, the banks are stadiums full of 50 gallons drums of this shit- and the DTCC/ICC/OCC are the equivalent of a nuke. Counterparty risk, in the form of fuses, runs between all of them. What happens when enough factors on the system start to apply too much pressure? BOOM.
Why hasn’t anything happened?
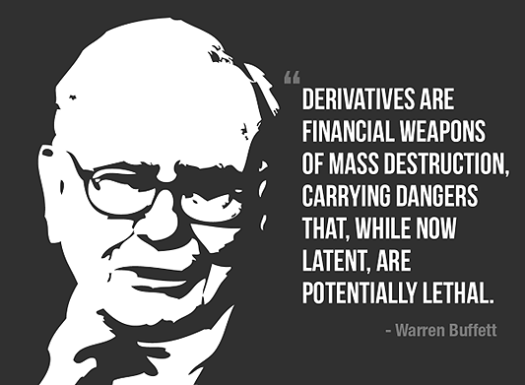
This is the question most people ask themselves when they first learn about this. The reason is actually very simple. As long as money keeps flowing into the Casino, the gamblers feel little risk, so no one pulls out. The Fed continues to print money, equity/bond prices continue to rise, and since there’s “no risk” of the underlying falling in value, everyone keeps their money in the pot, and the poker game continues. The profits made from derivatives trading are enormous, and any bank that stopped doing this would quickly lose investors, because they would instantly take their capital out and take it to another bank that actually is profitable. It’s all a confidence game- as long as everyone is confident, prices keep rising, and the cash keeps pumping in, the party will continue. Warren Buffet famously turned down calls to buy Lehman Brothers during the darkest days of the Financial Crisis- he understood a key concept, that derivatives (especially when they make up the majority of your fund are equivalent to Financial Weapons of Mass Destruction, able to destroy entire firms, and indeed entire systems, in one fell swoop.
In the tumultuous month of October 2008, this system was beginning to unravel. The money draining out of the financial system due to bank runs and frozen credit lending started to light fires in multiple financial institutions. The bombs that were Bear Sterns, AIG and Lehman had already blown up, and the fire was spreading through counterparty risk throughout the system. In fact, we were getting dangerously close to hitting the switch on the nuclear warhead- As Timothy Geitner (Pres of New York Fed) put it, “We were a few days away from the ATMs not working”. And the worst part of all of this? Even to this day, Regulators, and indeed even financial industry insiders, are completely blind to the risk. OTC Derivatives are essentially unregulated- NO ONE knows the true size of this market. Worse yet, the traders inside the bank are using optimistic versions of the Efficient Market Hypothesis and VaR models to estimate their risk, which comes out to essentially 0 due to the risk models and net exposure hedging. Thus, they pile on more risk every day, ensuring that this problem continues to grow until the entire system explodes.
Conclusion
The modern international financial system, unhinged from the fetters of regulation and oversight, has created a derivatives monster whose tendrils reach across the globe. Fed by the incessant money printer and holding the retirement funds of generations, this machine continues to bet, in ever-increasing amounts, in the greatest casino ever created. This monster, as long as it is nourished by cheap credit and ever increasing flows of cash from the Federal Reserve, will continue to grow. This is why the Fed is in the endgame- they KNOW that they cannot turn off the liquidity hose, as they would risk destroying the system in its entirety. They have to convince themselves and the market with constant assurances that inflation will remain low, risk is non-existent, and their balance sheet can continue to grow without consequence. Secretly, they are starting to realize they are in a burning building with no way out.
Nothing on this Post constitutes investment advice, performance data or any recommendation that any security, portfolio of securities, investment product, transaction or investment strategy is suitable for any specific person. From reading my Post I cannot assess anything about your personal circumstances, your finances, or your goals and objectives, all of which are unique to you, so any opinions or information contained on this Post are just that – an opinion or information. Please consult a financial professional if you seek advice.

I’m impressed, I must say. Seldom do I come across a blog that’s equally
educative and engaging, and without a doubt, you’ve hit the
nail on the head. The issue is an issue that not enough folks are speaking intelligently about.
I’m very happy that I stumbled across this in my hunt for something
concerning this. holidays on gozo